Generating reports and charts is quite easy in SPSS. You should be aware of the various options available so that you could select relevant pieces of information from the dialog boxes.
The most important report in SPSS is known as Descriptives. This option can be invoked by clicking Analyze -> Descriptive Statistics -> Descriptives. In the dialog, you can enter the Variables whose descriptives you want to show in the report. The Descriptives dialog window will let you enter any numeric variables in your dataset – including nominal and ordinal variables. Means and standard deviations are not appropriate or meaningful for nominal and ordinal variables. Make sure that you understand how your variables are coded and what they represent before you start your analysis.
Click on Options… tab to see the available options. You will see the following dialog box:
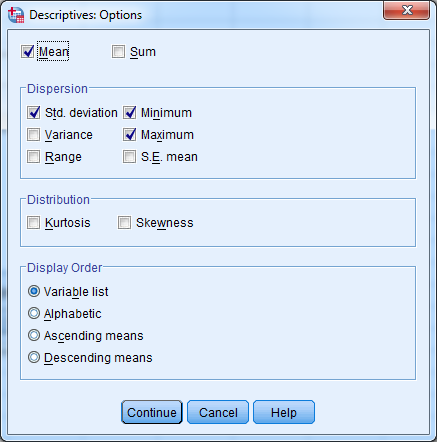
Mean is the average value of the variable.
Std. deviation A quantity expressing by how much the members of a group differ from the mean value for the group.
Variance When the Variance of the dataset is slight, It represents data points that are close to the mean. When the Variance of the dataset is significant: It represents data points are far away from the mean.
Just as standard deviation measures each individual’s dispersion value from the sample mean, the standard error of mean (S.E. mean) measures the dispersion of all the sample means around the population mean.
There are three types of kurtosis: mesokurtic, leptokurtic, and platykurtic. When kurtosis is equal to 3, the distribution is mesokurtic. This means the kurtosis is the same as the normal distribution; it is mesokurtic (medium peak). Negative excess values of kurtosis (<3) indicate that the distribution is flat and has thin tails. Platykurtic distributions have negative kurtosis values. Positive excess values of kurtosis (> 3) indicate that distribution is peaked and possesses thick tails. Leptokurtic distributions have positive kurtosis values.
For skewness, if the value is greater than + 1.0, the distribution is right skewed. If the value is less than -1.0, the distribution is left skewed. For kurtosis, if the value is greater than + 1.0, the distribution is leptokurtik. If the value is less than -1.0, the distribution is platykurtik.
Selecting the Save standardized values as variables check box will compute new variables containing the standardized values (also known as Z scores) of each of the input variables. A Z score of 1 means that it is one standard deviation above the mean; a Z score of -1 means that it is one standard deviation below the mean.
Version 27 and above of SPSS also provide an option Create APA Style Tables
Practice all these concepts by using Example 5.
35 thoughts on “IBM SPSS Tutorial – Part 05 – Descriptives”