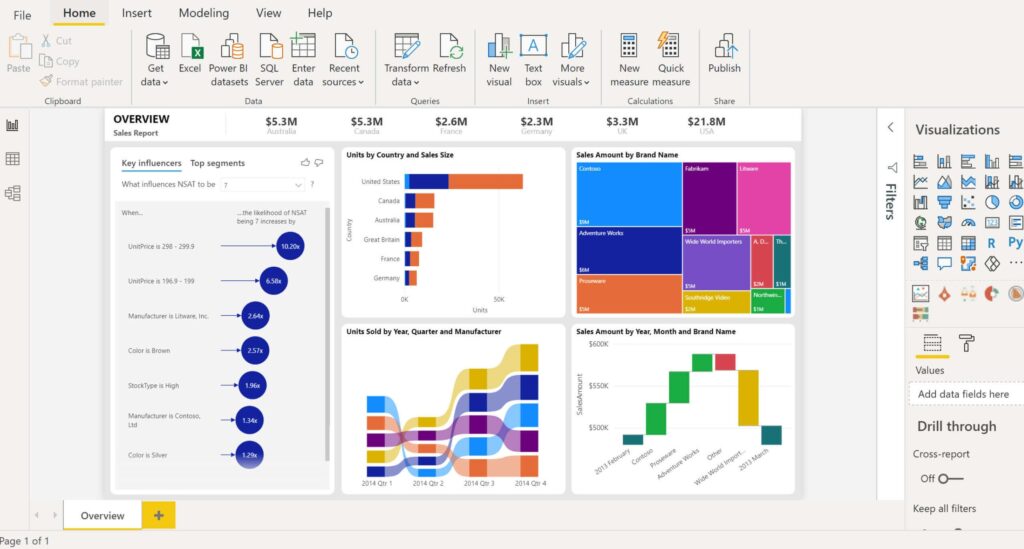
Power BI (Business Intelligence) is an interactive data visualization software in which raw data can be presented through different graphs, slices, and connectors. The product is developed by Microsoft and is part of the Microsoft Power Platform.
Power BI provides cloud-based BI services, known as “Power BI Services”, along with a desktop-based interface, called “Power BI Desktop”. Microsoft also released an additional service called Power BI Embedded on its Azure cloud platform. A unique aspect of this new service is the ability to load custom visualizations.
Different products available in the Power BI suite are as follows:
- Power BI Desktop
- Power BI Pro
- Power BI Premium
- Power BI Mobile
- Power BI Embedded
- Power BI Report Server
Power BI pricing is available as Power BI Pro Per User, Power BI Premium Per User, and Power BI Premium Per Capacity. Power BI Desktop is available free of cost. Power BI can be used with Azure as well as Microsoft 365. Power BI Pro is included in Microsoft 365 E5. You can view the complete pricing at this link:
https://powerbi.microsoft.com/en-us/pricing
Here are some more interesting facts about Microsoft Power BI:
Interesting Facts
- The Home Page of Power BI is https://powerbi.microsoft.com/en-us
- You can download Power BI from the following link: https://powerbi.microsoft.com/en-us/downloads
- The Power BI cloud platform can be accessed at https://app.powerbi.com
- You can view amazing Power BI dashboards at https://excelguru.pk/power-bi-dashboard
- You can learn Power BI from videos by experts here: https://powerbi.pk/powerbivideos
- Microsoft offers certification as Microsoft Power BI Data Analyst for which you need to pass Exam PL-300. You need to score 700 out of 1000 to pass this course.
- In Karachi, Pakistan, you can attend training sessions for Exam PL-300 at https://www.onwire.pk and https://mooninternationalpak.com
- Three main elements of the Power BI dashboard are 1) Card 2) Visuals 3) Slicer/Filter
- There is no final version of Power BI yet because the service is continuously evolving and new features are being added by Microsoft.
- Power BI is superior to Excel in that there is no limit of maximum data rows, In the case of Excel, the data can be entered up to 1,048,576 rows. Moreover, the Power BI dashboard can be published in the cloud and accessed in real time by business managers.
- Excel Add-Ins map to Power BI gadgets as follows:
| Excel Add-In | Power BI |
| Power Query | Edit Query |
| Power Pivot | Dax / Modelling |
| Power Map | Map |
| Power View | Report |
- For Power BI, the database structure is written in SQL, cloud services are deployed on Microsoft Azure, and Power Query Formula Language is informally known as “M”. You can view the M language code by clicking on Advanced Editor in Power Query.
- Power BI is only a showcase/visualizer for the data. Unlike Excel, there is no facility to enter data in different cells. You can only visualize the data entered in other data sources such as Excel, SQL Server, or Oracle.
- All visuals in Power BI communicate with one another. So, for example, if you select the particular year 2021 in one of the cards, the data in other visuals will also be displayed for the year 2021.
- You can use the Bookmark feature in Power BI to enable navigation between pages or reset the selections made in the current visual. For this purpose, you may create an image and use the action property of the image.
- If you have added new rows or new columns to the source data, you can click the Refresh button to reflect the new data in visuals. In the online version of Power BI, you can also set an interval for the auto-refresh of data.
- When selecting a data source, you can either select a file or use the Direct Query option. When you use the Direct Query option, the data source points to the place where the data is stored and you need not update the files again and again.
- A disadvantage of Power BI is that all the underlying data is viewable to the end user in the desktop version. In the online version, however, row-level security can be implemented.
Steps to Create an Online Account
Follow the below steps to create an online account of Power BI. This method will create a trial account for 60 days. You will have all the functionality but you will not be given Admin rights. Use an email of yours in which the domain is an organization and not a free email domain like gmail, yahoo.
- Go to https://powerbi.microsoft.com/en-us
- Click Try free on the top right
- Enter the email with your organization’s domain
- Click Submit
- In section 1, select I got it from my organization
- Click Next
- In section 2, Enter the following:
- First name
- Last name
- Country or Region
- Business phone number
- Create and Confirm the Password
- Enter the verification code sent to the email
- Put a checkmark on the two checkboxes
- Click Next
- Click Sign In
- Click Get Started
- You will now have access to all features of the Power BI online account. However, if you click Admin, you will not be allowed to access the Admin panel. A message will appear as follows:
To start using the Microsoft 365 admin center, you need to become an admin for [domain]. To do this, confirm that you own the web address you sign in with: [domain].
- On the top right, on your profile icon, click to display the dialog box and then click Start trial
Useful Resources
Power BI March 2023 Feature Summary
https://powerbi.microsoft.com/en-us/blog/power-bi-march-2023-feature-summary
Aga Khan University optimizes operations to improve services with Microsoft Azure
https://customers.microsoft.com/en-us/story/1574686253130942659-aga-khan-university-higher-education-azure-en-pakistan